
Investigating y=asin(bx+c)
by
Lizzy Shaughnessy
Assignment 1- Problem #5
Examine the graphs of .gif) for different values of a, b, and c. Provide a mathematical interpretation of the parameters a, b, and c. Explore using animations to illustrate the impact of each parameter.
for different values of a, b, and c. Provide a mathematical interpretation of the parameters a, b, and c. Explore using animations to illustrate the impact of each parameter.
In this assignment, we will consider the function .gif) . First let's look at the parent graph,
. First let's look at the parent graph, 
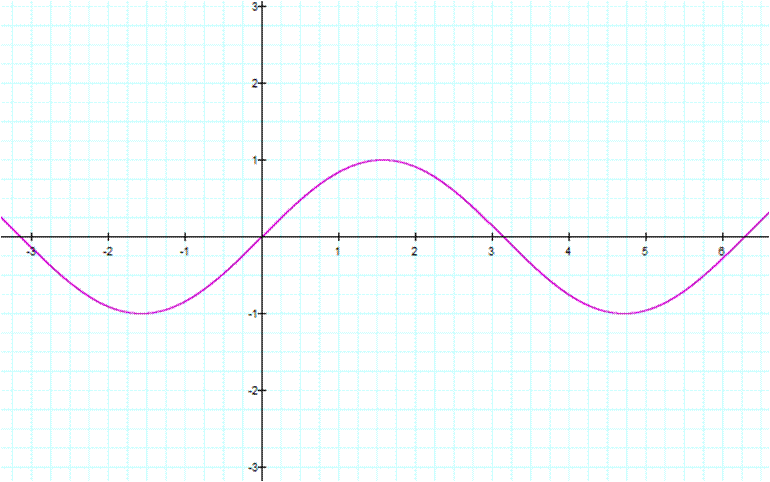
Some characteristics of this function:
- The domain is all real number and the range is [-1,1]
- The y-intercept is 0
- The x-intercepts are integer multiples of π
- The function has a period of 2π, meaning the function repeats every 2π (2π≈6.2831) (When looking at the graph, we want to see how long it takes to have one bump above the x-axis and one bump below the x-axis. Once this has occurred, the function has completed one period.)
The first parameter we will consider is a. How does the value of a affect the function 
We will evaluate the function =asin(x) at x=pi%3A4 and a=1.gif)
=1sin(pi%3A4)=1*sqrt2%3A2=sqrt2%3A2.gif)
So when a=1, =sqrt2%3A2..gif) So the y-coordinate of the point is not affected by the value of a. What about if a>1? The following table shows the function with varying values of a and evaluated at
So the y-coordinate of the point is not affected by the value of a. What about if a>1? The following table shows the function with varying values of a and evaluated at  .
.

As we can see from the table above, as the value of a increases, the y-coordinate increases by a factor of a. Now we will look at how a affects the graph of 
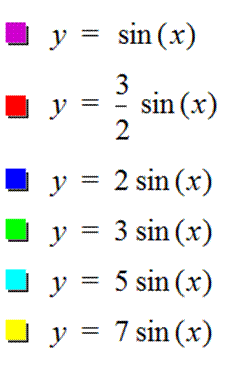
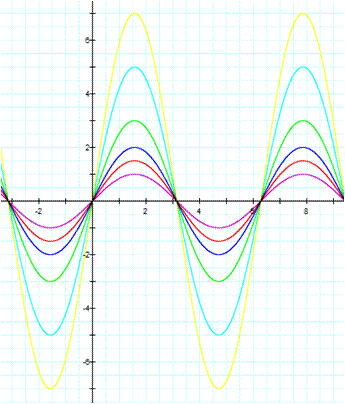
Now we know if a>1, then the graph is stretched vertically and the range of the function is affected. What if a=-1?
We will evaluate the function =asin(x) at x=pi%3A4 and a=1.gif)
=-1*sin(pi%3A4)=-1*sqrt2%3A2=-sqrt2%3A2.gif)
So an a value of -1 simply makes the y-coordinate negative. Now we will consider when a<-1. The following table shows the function with varying values of a and evaluated at  .
.

Before we look at the graphs of these function, we will look specifically at the difference between the graphs of =1*sinx and f(x)=-1*sinx.gif)
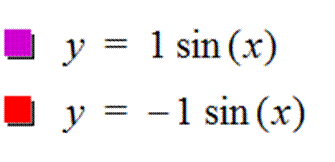
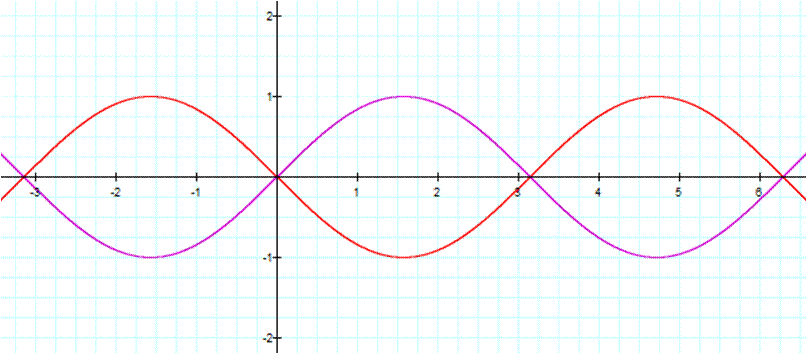
So the only difference between  and
and  is that the y-coordinates are multiplied by a factor of -1. That is, the graph of
  is reflected about the x-axis.
Now we will look at the graph of  with the different a values we used in the second table.
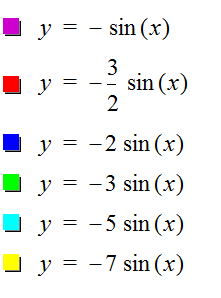
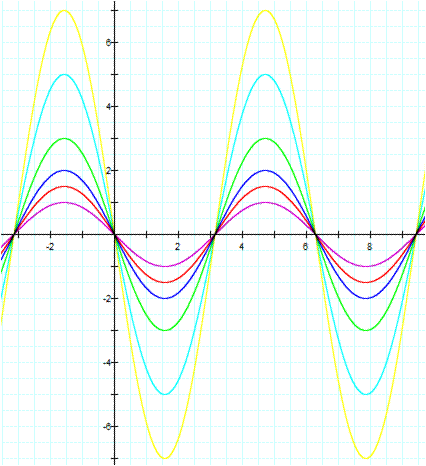
From the algebra and graphs above, we can tell that if a<-1 then the graph of  is reflected about the x-axis.
What about if -1 < a < 1? The following table shows the function  evaluated at

The above table shows us that if -1 < a < 1 then the graph is compressed vertically and the range of the function is affected. Now we will look at the graphs of these functions.
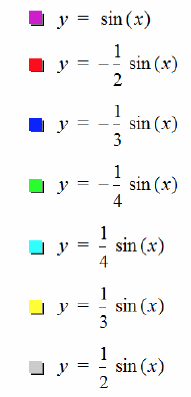

We have now found that if a is negative then the graph of  is reflected over the x-axis. If a > 1 or a< -1 then the graph is stretched vertically by a factor of
  If -1 < a < 1 then the graph is compressed vertically by a factor of
Next, we will consider the effect of parameter b on the function  First, let's recall that
=sin(pi%3A4)=sqrt2%3A2.gif)
So when b = 1,
=sqrt2%3A2.gif)
We will investigate the effects of b by looking at the graphs of the functions with different b values.
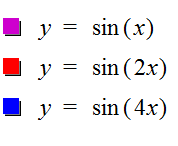
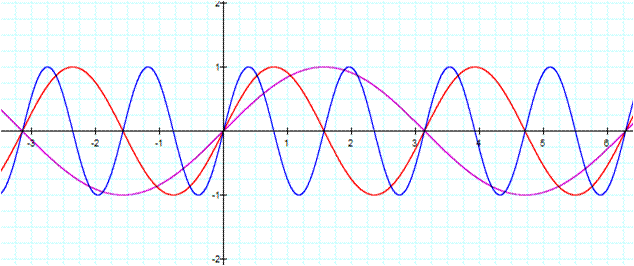
From the graph we can tell that if b > 1 then the graph is compressed horizontally. As mentioned before, the period for the function  is
is  , meaning the function repeats every
  (remember
  ≈6.2831).
Since increasing the value of b causes the function to compress horizontally, how will this affect the period?
As we mentioned before, once the graph has one bump above the x-axis and one bump below the x-axis then the function has completed one period. To see this more clearly, below is a graph of just the  function.
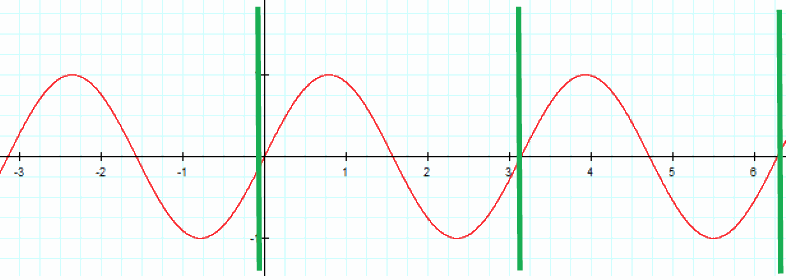
The green lines marks each time there is a bump below the x-axis and a bump above the x-axis. So between each green line we have a period of the function. So we have a period of π for the function  .
.
Now let's look at the  . The graph of the function is shown below.

Again, between each of the green lines, we have a bump below the x-axis and a bump below the x-axis. Therefore we have a period between the green lines and the period is 
Before we draw some conclusions about the effects of parameter b we will consider when 0 < b < 1. Let's look at the graph of some functions with 0 < b < 1.
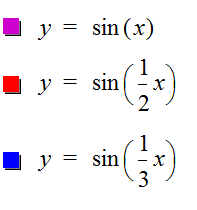

So it appears that if 0 < b < 1 then function stretches out and the period of the function is increased.  repeats every
  so the period is 4π.
  repeats every
  so the period is 6π.
Here is a summary of what we have found so far concerning the parameter b:
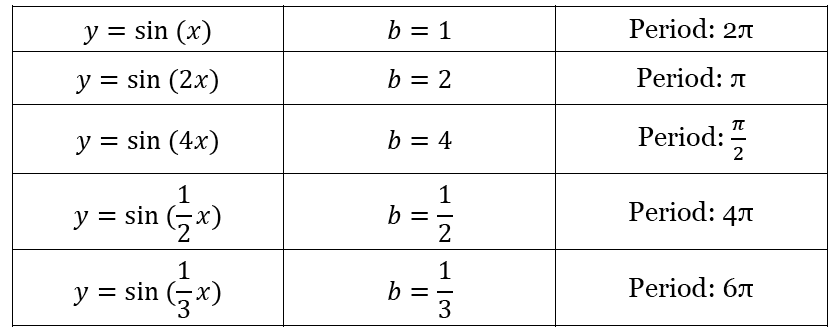
As the value of b increases by a factor of 2, the period of the function decreases by the same factor and as the value of b decreases, the period of the function increases. Therefore the period of the function  is equal to
  then the function will compress horizontally and if
  then the function is stretch horizontally.
 is an odd function so
  . Therefore, we do not need to address if b < 1 because we have really already addressed this when we discussed the parameter a.
Finally, we will look at how the parameter c affects the function  . We will start by looking at the function when c = -1, c = -.5, c = .5, and c = 1.
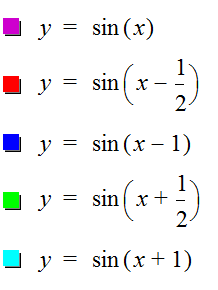

We can see the functions have the same period and amplitude. The only is that the function  is shifted to the right or to the left. If c < 0 the function is shifted to the right and if c > 1 then the function is shifted to the left.
We can rewrite the function  Once we have written our function in this format, the horizontal shift of the function is
So for the function .gif) , the parameter a affects the amplitude of the function, parameter b affects the period of the function, and the parameter c affects the horizontal shift of the function.
, the parameter a affects the amplitude of the function, parameter b affects the period of the function, and the parameter c affects the horizontal shift of the function.
Return Home

for different values of a, b, and c. Provide a mathematical interpretation of the parameters a, b, and c. Explore using animations to illustrate the impact of each parameter.
![]() . First let's look at the parent graph,
. First let's look at the parent graph, ![]()

=1sin(pi%3A4)=1*sqrt2%3A2=sqrt2%3A2.gif)
=sqrt2%3A2..gif) So the y-coordinate of the point is not affected by the value of a. What about if a>1? The following table shows the function with varying values of a and evaluated at
So the y-coordinate of the point is not affected by the value of a. What about if a>1? The following table shows the function with varying values of a and evaluated at 


=-1*sin(pi%3A4)=-1*sqrt2%3A2=-sqrt2%3A2.gif)


=sin(pi%3A4)=sqrt2%3A2.gif)
=sqrt2%3A2.gif)


 then the function will compress horizontally and if
